Enhanced Interface
Exploring Reports in the Enhanced
Interface
|
<< 2 of 24
>> |
|
When you explore reports
in the Enhanced interface, there are a number of ways you can
view information and perform actions on the data. For example,
you can drag and drop and right-click throughout the Enhanced
interface.
There are 5 major areas that make up the
Enhanced interface:
|
Dimension Viewer
 |
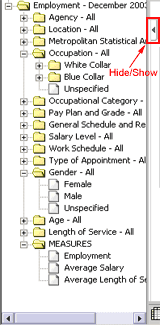
The dimension viewer
shows a full tree view of the dimensions and measures in a
cube. This view helps you understand the data structure and
find the items you require. In the dimension viewer, you see
an organized view of all dimensions, levels, and categories in
a selected cube in a Windows folder-like presentation. You can
drag items from the dimension viewer to add categories to rows
and columns, perform filtering, and reorganize the dimension
line on either a crosstab or a chart. You can also right-click
the categories to perform actions on the data.
In the dimension viewer,
the following actions can be accomplished using drag and drop
or right-clicking:
- change a row or column
- change a measure
- create a nested crosstab or chart
- filter
If you prefer to use the
full browser window for the display, you can close the
dimension viewer by clicking the Hide/Show Dimension Viewer
button. 

|
Dimension Line
You can use the
dimension line to add categories to rows and columns, and
filter the data in the cube. You can drag items from the
dimension line to the crosstab or chart, or you can
right-click the categories to view information about the data.


Display
In the FedScope display, you can right-click to perform actions that are
associated with individual data elements. When you right-click
the row and column headings, or data cells, the available
actions appear in a flyout menu.


Level Selector Toolbar
You can left-click the
row and column level selector areas to open the level selector
toolbar. The level selector toolbar contains the following
toolbar buttons:
| Button |
Description |
|
Expand button 
|
Expands the category to show the next level of data.
|
|
Delete button 
|
Deletes the level of data shown.
|
|
Swap Left button 
|
The selected row category becomes the parent of the nested
level.
|
|
Swap Right button 
|
The selected row category becomes the nested level.
|
|
Swap Up button 
|
The selected column category becomes the parent of the
nested level.
|
|
Swap Down button 
|
The selected column category becomes the nested level.
|
|
Down a Level button 
|
The data changes to show the next-lower level of data in the
category.
|
|
Up a Level button 
|
The data changes to show the next-higher level of data in
the category.
|
|
Explain button 
|
Shows an explanation of the information you are exploring.
|


Toolbar
Many of the controls in
the Enhanced interface are available from menus or dialog
boxes that you open from the toolbar.
For example, to use the
best horizontal scaling for a chart in the Enhanced interface,
you would click the Display Options  button on the toolbar, and in the Display Options dialog box,
select the Fit Charts check box.


|


 button on the toolbar, and in the Display Options dialog box,
select the Fit Charts check box.